
Tapflare Article
AI in Power BI for Real-Time Business Intelligence
Inside this article
Executive Summary
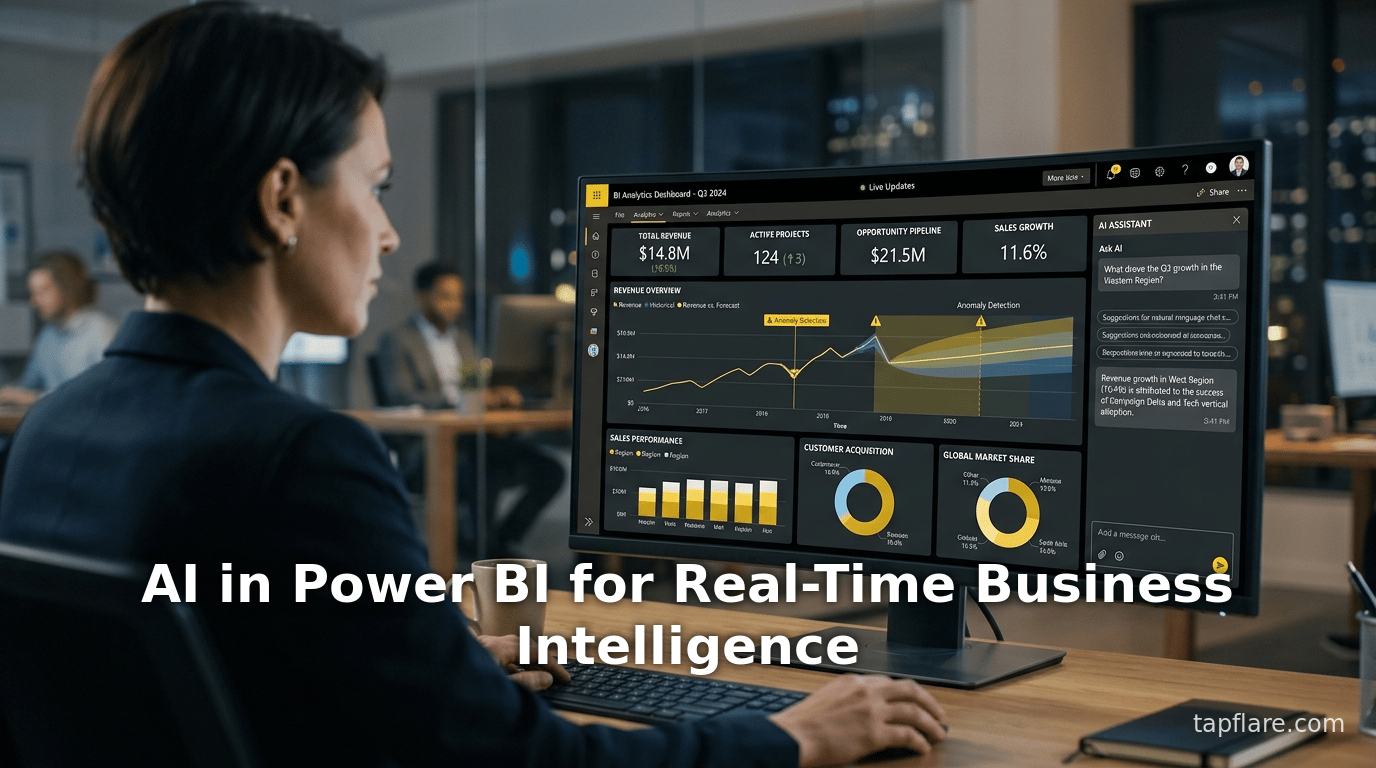
The integration of artificial intelligence (AI) with Microsoft Power BI is revolutionizing how organizations perform real-time business intelligence (BI). By combining Power BI’s advanced analytics and visualization platform with AI-driven data analysis, businesses can ingest live data streams, automatically detect patterns, and generate actionable insights all in real time. This permits decision-makers to respond faster and more proactively to emerging trends or issues. For example, Microsoft reports that its real-time streaming feature in Power BI “helps you stream data and update dashboards in real time,” enabling any visual to continuously display live data from sources such as sensors or social media [1]. In practice, organizations like TransAlta (a power company) and Piraeus Bank (a finance firm) have leveraged Power BI streaming datasets to monitor industrial and web metrics live, giving end-users instant operational visibility [2] [3].
AI enhances these real-time capabilities further. Power BI natively incorporates ML and generative AI functions—such as anomaly detection, forecasting, natural-language querying, and automated narrative generation—that accelerate insight discovery. Anomaly detection in Power BI, for instance, “automatically detects anomalies in your time series data” and even provides explanations to aid root-cause analysis [4]. Copilot for Power BI (a recent addition) uses large language models to interpret queries, craft DAX formulas, and generate textual analysis on-the-fly, unlocking data for “citizen analysts.” In one case, Reckitt’s marketing team reported a 60% increase in efficiency using Azure OpenAI and Power BI’s Copilot to generate consumer insights and test marketing ideas [5]. In another, PepsiCo achieved 85% adoption of AI-driven inventory recommendations and improved forecast accuracy by ~40% by combining Azure Machine Learning models with Power BI dashboards [6].
These examples illustrate a clear trend: AI-powered Power BI enables actionable, real-time intelligence at unprecedented speed. Companies report dramatic improvements in decision-making time and outcome accuracy. A mid-size logistics firm replaced hours of spreadsheet reporting with live Power BI dashboards, realizing an 80% reduction in manual reporting time and surfacing operational issues within hours rather than days [7]. A global manufacturer’s plant monitoring, re-engineered with Power BI and Azure Fabric, cut OEE reporting delays by 35% (to true real-time) and uncovered $2.1M of waste in a single quarter [8]. And in healthcare, a patient-monitoring application built on Power BI continuously analyzes vital signs to preempt crises – an intervention that directly reduced emergency “code blue” events [9].
This report provides an in-depth examination of these developments. We begin by tracing the evolution of BI and the growing imperative for real-time insights, then detail Power BI’s AI-enabled features and real-time streaming capabilities. Through data-driven analysis and case studies, we demonstrate how enterprises apply AI+Power BI to drive smarter, faster decisions. We also consider broader implications – including governance, data quality, and workforce readiness – and conclude with future directions, such as generative models and Microsoft Fabric’s Real-Time Intelligence. In all sections, claims are supported by credible sources and empirical data, underscoring how AI enhancements are truly “unlocking” next-generation BI in the enterprise.
Introduction and Background
Business Intelligence (BI) refers to the tools and processes that transform raw data into actionable insights for business decision-makers [10]. Historically, BI systems were designed for periodic reporting on historical data. Classic BI provided post-hoc analyses, where executives and analysts consumed periodic reports (daily, weekly, monthly) to inform strategic and tactical decisions. However, in the modern fast-moving business environment, organizations increasingly demand real-time BI – the ability to see live, up-to-the-minute data and act immediately. Real-time BI (RTBI) uses streaming data pipelines and analytics to deliver continuous visibility. As TechTarget explains, RTBI “combines data analytics and various data processing tools to enable access to the most relevant, up-to-the-minute data and visualizations,” contrasting with traditional BI’s reliance on historical data [11] [12].
The drive toward real-time intelligence stems from competitive pressures: companies want to detect issues or opportunities as they occur. A study notes that without near-real-time metrics, teams often “respond after issues occur rather than proactively managing them” [13]. This latency gap – between data availability and decision-making – has motivated a shift in BI. What were once acceptable daily or weekly reports now seem too slow. Researchers Dobrev and Hart argue that, while value-adding, RTBI is technologically complex and costly; nonetheless, traditional BI’s inability to close the “latency gap between information and action” makes real-time systems increasingly vital [14].
Meanwhile, Artificial Intelligence (AI) has evolved rapidly. Early BI tools incorporated elements of machine learning and statistical algorithms to aid analysis (e.g. forecasting). Today, “AI” can mean many things: machine-learning models (regression, tree algorithms, etc.), advanced statistical pattern recognition, and the recent wave of generative AI (large language and foundation models capable of synthesizing text, code, and insights). These AI capabilities can automate insight discovery: finding trends, anomalies, or predictions without explicit human coding. In BI products, integrated AI aims to empower business users with near-autonomous analytics. For example, Power BI introduced features like Quick Insights (automated trend detection) and Key Influencers (statistical factor analysis) years ago. With the advent of powerful ML platforms (Azure ML) and cognitive services, BI tools can now embed sophisticated AI: from text and image analysis to predictive recommendations. Generative AI (such as GPT-based systems) adds natural-language understanding and output.
Microsoft’s Power BI, launched in 2015, has become one of the most popular BI platforms globally. It connects to myriad data sources and provides dashboards, reports, and self-service analytics to business users. Power BI’s growth has been “staggering,” processing over 20 petabytes of data per month and executing more than 12 million queries per hour across 30 million active dashboards [15]. This level of usage underscores its role in modern analytics.Gartner has recognized Microsoft as a Leader in Analytics/BI for more than a decade [16]. Surveys show broad adoption: for example, an industry poll found that 61.0% of organizations using BI tools had implemented Power BI – far more than any competitor (Source: kn.itmedia.co.jp).
Power BI’s architecture (Desktop client plus cloud service) and its integration with Microsoft Fabric/Azure data platforms make it well-suited for real-time streaming and AI. On the data side, Power BI supports streaming datasets, push APIs, and live connections (DirectQuery/DirectLake) that can continuously update dashboards [1]. On the AI side, Power BI offers built-in analytics (see next section) and can call external ML/Cognitive services. Crucially, Microsoft’s strategy for Power BI emphasizes infusing AI into every layer of BI, rather than BI just being a passive data viewer [17].
This report explores how AI and Power BI combine to deliver real-time BI. We will first examine Power BI’s real-time data capabilities, then its AI features, and then illustrate how these are applied in practice. Each claim is supported by evidence: vendor documentation, analyst reports, and detailed case studies (with metrics). Through this, we will show that AI-augmented Power BI is enabling faster insights, predictive guidance, and greater automation – fundamentally transforming business intelligence from static reporting to dynamic decision support.
Evolution of Real-Time BI and AI in Analytics
Traditional BI vs. Real-Time BI
BI began decades ago as computerized reporting on historical data. Early systems offered static reports and dashboards refreshed daily or weekly. As B.I. matured, data warehouses and OLAP cubes enabled more interactive analysis, but these systems were still batch-oriented. In many organizations, data collection and ETL pipelines introduced lag: managers often waited significant time before seeing the previous day’s results. Today’s business environment outpaces those cycles. Consumer demands, IoT sensor streams, and high-frequency transactions require immediate awareness.
Real-time BI (RTBI) addresses this need. RTBI architectures incorporate continuous data flows and analytics to shrink latency. Data virtualization, complex event processing, and streaming databases form part of this stack [18]. In RTBI, incoming events (e.g. sales transactions, machine readings, social media mentions) are ingested instantly, processed (often with minimal aggregation), and visualized immediately. Users see a live “view” of operations. TechTarget defines RTBI as combining analytics and processing tools to give “up-to-the-minute data and visualizations,” enabling enterprises to make smarter instant decisions [11]. The payoff is speed: instead of reacting in days, organizations can act within minutes (or seconds) of a significant change.
However, RTBI is not trivial to implement. Early streaming BI required complex pipelines and often manual coding. Traditional BI styles focus on stable, well-structured data; by contrast, RTBI must handle constantly changing streams and ensure dashboards refresh promptly. Despite these challenges, a shift has occurred. Companies increasingly adopt operational BI solutions. For example, since 2017 Microsoft Power BI supports streaming datasets: data can be pushed via REST APIs or event streams into a live dashboard [19]. Analysts now routinely compare RTBI to enterprise scenarios in finance, healthcare, retail, and IoT, all of which demand immediacy. A case study by Wavicle Data noted that without real-time access to inventory metrics, supply-chain teams “are forced to respond after issues occur rather than proactively managing them” [13].
In short, real-time BI is a powerful extension of the BI paradigm. It replaces static lagging indicators with continuous insight. Yet even real-time streams need interpretation. Spikes or trends in a dashboard don’t automatically yield decisions. This is where AI steps in, automating analysis of streaming data and reducing the cognitive load on users.
Emergence of AI in Business Analytics
Concurrently, AI and machine learning have revolutionized data analysis. In the past decade, advances in compute and algorithms (especially deep learning and cloud-based ML) have allowed computers to find complex patterns in data without explicit instructions. Modern BI platforms embed these capabilities as AI-driven features. For instance:
- Statistical Pattern Mining: Tools like Power BI Quick Insights automatically detect clusters, outliers, and trends in a dataset without manual queries.
- Predictive Modeling: AutoML systems (e.g. Azure AutoML) can train forecasting models and recommend future values.
- Natural Language Processing (NLP): Conversational query interfaces let users ask questions in plain language. Power BI’s Q&A feature and the new Copilot allow analysts to type questions and get charts or textual answers.
- Anomaly Detection: Built-in algorithms identify unexpected data points (e.g. sales spikes) so users can investigate automatically [4].
- Computer Vision and Text Analytics: Integration with services like Azure Cognitive Services enables analyzing unstructured data; for example, extracting sentiment from comments or counting objects in images, then feeding those results back into dashboards.
These AI components are woven into Power BI’s workflow. As one Microsoft blog noted in 2019, “Power BI has led the way in infusing AI with BI” [17]. Microsoft announced tools like Key Influencers (to rank factors driving a chosen metric), Distribution Changes (to compare category distributions), and seamless connectivity to Azure ML and Cognitive Services for advanced enrichments [20] [21]. Over time, Power BI introduced Smart Narrative captions (auto-generated text summaries of report pages) and the decomposition tree visual, expanding the reach of AI-generated insight.
Notably, current trends emphasize generative AI. The latest Copilot features use large language models (LLMs) to go beyond scripted algorithms: they can interpret vague user prompts, write DAX queries behind the scenes, and craft coherent narratives. As the Reckitt marketing case illustrates, generative AI in Power BI can essentially “generate” marketing ideas and test them, effectively partnering with human experts [5]. While traditional BI shows what happened, AI-driven BI aspires to explain why, often requiring fewer clicks by the user.
From the historical perspective, BI has moved from passive historical reporting to proactive intelligence. Traditional BI tools offered charts on demand; AI-enabled BI tools now recommend which charts to make, what patterns to highlight, and what actions to take. The next sections explore Power BI’s real-time and AI features in depth, before diving into concrete examples of their synergy.
Power BI’s Real-Time Data Capabilities
Microsoft Power BI offers multiple mechanisms to support real-time data ingestion and live analytics. The cornerstone is the Power BI Service (cloud), where live dashboards and streaming datasets reside. Key features include:
-
Streaming Datasets: Users can push data into Power BI via several channels (REST API, Azure Event Hubs, PubNub, etc.). Such streaming datasets feed live dashboards and tiles. In 2017, Microsoft announced these streaming datasets as generally available: “Power BI streaming datasets allow users to easily stream data via the REST API, Azure Stream Analytics, or PubNub, and to see that data instantly light on their dashboards” [19]. Once in Power BI, visuals pinned to a dashboard from a streaming dataset update in real time whenever new data arrives. This enables truly live monitoring (e.g., showing the latest sensor reading or the current value of a KPI without delay).
-
Push vs. Streaming Models: Power BI distinguishes push and streaming semantic models. A push semantic model (or push dataset) actually adds data to a database in Power BI as it arrives, so full reports and visuals (with filtering, cross-highlighting, etc.) can be built on it [22] [23]. A streaming semantic model, by contrast, only holds data in a short-lived cache to feed live tiles, without backing store for building reports [24] [25]. In practice, push models power dashboards that require historical context, while streaming models serve ultra-low-latency displays (e.g., moving charts over the last hour).
-
Data Sources for Streaming: Any time-sensitive data collection can become a stream. Microsoft explicitly lists factory sensors, social media, usage metrics, and “many other time-sensitive data collectors or transmitters” as valid inputs [1]. Custom applications can also write to the Power BI service through its Azure-powered REST API. The source data might be IoT devices, clickstreams, or even in-memory triggers. For example, a power plant can push turbine telemetry or an e-commerce site can push site traffic events directly into a Power BI dataset.
-
Integration with Azure Streaming: Azure Stream Analytics (ASA) often serves as the bridge. ASA can ingest millions of events per second from IoT or message hubs, perform real-time calculations, and output to a Power BI streaming dataset. Microsoft highlights customer stories where ASA + Power BI deliver live insights. TransAlta (renewable energy) uses ASA to process sensor data in flight and push it directly into Power BI dashboards for field technicians [2]. Similarly, Piraeus Bank feeds its web banking metrics through ASA into Power BI, giving an up-to-the-minute view of platform KPIs [3]. These integrations allow complex transformations (windowed aggregates, anomaly detection) to occur before the data hits Power BI, keeping reports fast and responsive.
-
Dashboards and Reports: Any visual or dashboard built in Power BI can display streaming data once properly configured. Visuals pinned to dashboards (as tiles) update automatically on new data. Power BI triggers a tile refresh each time new data is received [26]. Users can also query streaming models via the Q&A (natural language) feature, with answers reflecting the latest data [27]. This means even narrative or Q&A interactions can be (short-term) live.
-
Practical Limits and Evolution: Microsoft documentation notes that the classic Power BI streaming datasets feature will eventually be superseded by Fabric’s new Real-Time Intelligence service: “Creation of streaming models remains enabled until October 31, 2027. … Microsoft recommends users explore Real-Time Intelligence in Microsoft Fabric.” [28]. This transition points to a unified streaming analytics platform. Indeed, Fabric’s Real-Time Intelligence (launched 2024) is designed to ingest large-scale streaming data natively into OneLake (the Fabric data lake) and directly tie into Power BI. This newer architecture promises even tighter integration of streaming analytics and BI. The reality today is that Power BI supports both legacy push/streaming modes and emerging Fabric pipelines, allowing organizations to adopt real-time BI in stages.
In summary, Power BI provides a robust real-time pipeline: devices/data sources → (optionally Azure streams) → Power BI streaming dataset → dashboards. The live dashboards give organizations instantaneous visibility. For example, an IoT-equipped machine can continuously send data that updates a live scatter plot, or a financial system can broadcast trades into a live KPI. These capabilities form the foundation upon which AI-driven analytics can operate as data arrives. Next, we examine how AI is integrated to make sense of these rapid updates.
AI-Powered Analytics in Power BI
Power BI incorporates AI at multiple stages of the analytic workflow, enabling users to go beyond static reporting and leverage machine intelligence. Key AI features include:
-
AI-Infused Visuals (Analytics Pane): Power BI’s Analytics Pane offers automated computations you can add to visuals. Notable examples:
- Forecasting: Power BI can extend a line chart with a predictive forecast (with confidence bands) based on historical trend. This uses a built-in statistical model requiring only that you specify the forecast length. It enables users to “explain by” forecasting future values without external modeling.
- Anomaly Detection: As noted earlier, adding “Find Anomalies” to a time-series visual lets Power BI automatically pinpoint data points that fall outside expected bounds. The system then “provides explanations for the anomalies to help with root cause analysis” [4]. This dramatically speeds up finding agenda-worthy variances (e.g. sudden sales spikes or dips) without manual drill-down.
- Key Influencers Visual: This specialized visual statistically determines which fields most influence a chosen metric. For example, to understand employee churn, the key influencers visual might rank factors like tenure or commute time by their impact [29]. Using advanced algorithms under the hood, it highlights the primary drivers automatically.
- Decomposition Tree: An “AI visual” that lets users iteratively break down a metric by any dimension, with suggestions for which splits reveal significant changes. It can automatically suggest splits that explain variance.
- Smart Narrative: Power BI can generate a textual summary of a report page or a specific visual. This smart narrative feature scans the data behind slicers/filters and writes a narrative listing key insights and trends [30]. For example, when added to a sales report, it might say “Net Revenue increased by 12% due to strong sales in Europe and a price promotion,” guiding the reader through highlights. As Microsoft notes, smart narratives provide “relevant and innovative insights… [to help] name key findings, highlight trends, and adapt the language to the audience” [30].
-
Machine Learning Integration (Azure ML & Cognitive Services): Power BI tightly integrates with Azure AI offerings. Dataflows in Power BI Premium can call Azure Cognitive Services for text, image, or sentiment analysis: e.g. extracting key phrases from open-ended survey responses, or identifying logos in images. Likewise, Power BI can pull in outputs from Azure Machine Learning experiments. For instance, a data scientist can train a demand forecast model in Azure ML and publish it as a web service. Power BI can then invoke this ML model on its data and return the predictions inside a report. In 2019, Microsoft announced the general availability of this integration, noting it gives analysts “a toolkit of powerful AI functions” [20]. These enable sophisticated analyses normally reserved for data science teams.
-
Natural Language Query (Q&A and “Copilot”): Power BI allows users to ask data questions in plain language. Its Q&A feature (launched 2015) parses English questions and generates visuals. For example, typing “top 10 products by sales last year” can instantly produce a bar chart. Brands and synonyms can be trained so Q&A understands the business domain. In 2024, Microsoft extended this idea with Power BI Copilot, a conversational AI assistant. Copilot in Power BI leverages generative LLMs to allow chat-like interactions. Users can ask Copilot to perform ad-hoc analyses (“What were the main factors in the revenue drop last quarter?”) or even generate DAX formulas on demand. As Microsoft describes it, Copilot “provides chat-based experiences” that help with tasks from quick analysis for business users to DAX generation for advanced report designers [31]. This means non-technical users can get immediate insights just by asking, and analysts can get writing assistance.
-
Auto Insights (QuickInsights, etc.): Power BI can scan a dataset and automatically highlight outliers or correlations. The Quick Insights feature (analyzed during the dataset refresh) identifies interesting patterns (e.g. “Product X had unusually high demand in March in region Y”) and notifies the user. Similarly, Power BI can generate suggested visuals when importing new data, guiding users to likely significant metrics. These automated “explorations” allow rapid skimming of hundreds of fields.
Collectively, these AI-enhanced features turn Power BI into an intelligent assistant. For example, Fortune 500 companies use the Key Influencers visual to track drivers of key metrics, often discovering non-obvious relationships in seconds rather than days of statistical analysis [29]. Anomaly detection charts save analysts countless hours by highlighting which data points to investigate first [4]. Conversely, predictive models integrated into reports (like PepsiCo’s demand intelligence) move BI from descriptive to prescriptive analytics.
It is important to recognize that AI in Power BI is designed to augment human analysts, not replace them. Analysts still guide the process (choosing the right models, validating AI suggestions, and making decisions on complex issues). As industry experts caution, even powerful AI generators can hallucinate or make incorrect inferences if unchecked [32] [33]. Therefore, best practice is human-in-the-loop: users must verify AI-driven results. For instance, Power BI’s anomaly detection highlights a data spike and provides possible causes, but the analyst confirms if it is a true data issue or a processing glitch [4]. Likewise, when Copilot suggests a narrative or calculation, an expert should validate domain relevance.
Despite the need for oversight, the concrete benefits are clear. We summarize some in the table below, which links specific Power BI/AI capabilities to business outcomes:
Table 1: AI and Real-Time Analytics Capabilities in Power BI
| Capability | BI Value / Function | Examples & Impact |
|---|---|---|
| Real-Time Streaming | Stream live data into dashboards that auto-refresh. Great for monitoring operations and IoT feeds. [1] | TransAlta used Azure Stream Analytics + Power BI to show live equipment performance to technicians, enabling immediate response [2]. Piraeus Bank streams web KPIs in real time for instant scaling decisions [3]. |
| Predictive (AutoML) | Built-in forecasting and Azure ML integration to predict trends and outcomes. | PepsiCo deployed Azure Machine Learning with Power BI to forecast store inventory needs; models delivered 40% better predictions and saved ~4,300 workdays/year [6]. |
| AI Visuals & Narrative | Auto-generated insights like anomaly detection and narrative summaries. | Anomaly detection automatically flags unexpected data points in line charts, aiding root-cause analysis [4]. Smart Narrative turned a sales dashboard into a textual executive summary (e.g., “Sales up 10% due to new product launch”). |
| Natural Language / Copilot | Query data in plain language; Copilot (generative AI) can chat about data, create DAX, and generate commentary. [31] | Marketing teams at Reckitt used Copilot (with Azure OpenAI) to ask complex questions and generate campaign ideas. This “insights generator” boosted productivity by 60% according to Reckitt’s analytics lead [5]. Power BI’s Q&A allowed analysts at smaller firms to self-serve data queries without coding. |
| AI Governance & Data Quality (features) | AI-driven data preparation (outlier handling, imputations, semantic consistency). | Power BI can apply ML to fill missing values or LLMs to harmonize field names [34]. These ensure that streaming AI analytics are built on accurate, trusted data. |
Each of these capabilities plays a role in unlocking real-time intelligence. The streaming engine feeds fresh data; the AI engine (built-in visuals and integrations) continuously analyzes and contextualizes that data. Together, they shift BI from passive dashboards to active insight generators.
Case Studies and Real-World Examples
Below we examine concrete examples across industries that demonstrate AI + Power BI delivering real-time intelligence. Each case highlights specific benefits, metrics, and technologies used.
1. Energy – TransAlta (Renewable Power Monitoring): TransAlta (Canada’s largest renewable energy company) processes millions of sensor readings from dozens of power plants. By connecting Azure Stream Analytics to Power BI, TransAlta built dashboards that display live plant metrics to field engineers [2]. Azure Stream Analytics performs on-the-fly engineering calculations (e.g. aggregating kilowatt-hours), while Power BI tiles update instantly with the latest values. As one engineer noted, “the latest value [of key metrics] is now being available”, allowing immediate feedback on equipment health [2]. This live view improves safety (operators see anomalies as they happen) and efficiency (imbalances can be addressed before they exacerbate). Although detailed ROI numbers are proprietary, the deployment enabled peer transparency across 70+ plants and was cited as an example of Power BI’s real-time impact in Microsoft’s own blog [2].
2. Finance – Piraeus Bank (Real-Time Online Metrics): Piraeus Bank leveraged Power BI streaming to monitor its online banking platform 24×7 [3]. They set up Azure Stream Analytics to process web service logs and push them to a Power BI streaming dataset. This delivers live dashboards of key metrics (transaction counts, response times, error rates) for hundreds of branches. The real-time view allowed the bank’s IT and operations teams to “provision our service for different scalability needs and loads,” adjusting resources proactively rather than reactively [35]. In effect, the AI in this case is minimal (ASA is doing event processing), but the instant visibility qualifies as real-time BI. Piraeus reported that Power BI delivered “actionable events”; for example, a sudden surge in mobile logins immediately appears on dashboards so staff can address it [35].
3. Public Sector/Smart City – IntelliScape (Traffic Analytics): IntelliScape.io developed a curbside analytics platform that captures live video feeds and analyzes them to understand city parking and traffic flow. They integrated a real-time video analytics engine with Power BI via PubNub streaming. The result is Power BI dashboards that update multiple times per minute as video frames are processed. City managers get up-to-the-second updates on traffic congestion or curb occupancy [36]. This “smart city” use-case demonstrates real-time BI with an AI twist: the video analytics (AI-driven object detection) feeds the BI system. The dashboard is entirely live — there is virtually zero latency from camera to chart. By blending AI-driven video insights with Power BI, modern cities using this solution can respond to incidents (an accident, an illegal parking pattern) in near-real-time, something impossible with traditional traffic reports.
4. Logistics/Warehousing – Regional Distributor (Executive Dashboards): A mid-sized logistics firm (three warehouses across regions) replaced clunky Excel reports with Power BI dashboards. Before the project, operations staff spent ~15 hours per week manually compiling Excel reports from ERP and WMS, delaying visibility [37]. Digital Investment Group implemented a solution connecting ERP and warehouse databases directly into Power BI. Executives then gained permanent live dashboards of shipments, inventory levels, and delivery KPIs [38] [7]. The results were dramatic: manual reporting time dropped by 80%, data-entry errors disappeared, and executives could see issues (like stockouts) in “hours not days.” In their words: “issues identified within hours, not days,” and 100% adoption of Power BI dashboards among managers [39]. This case did not necessarily use AI beyond basic filtering, but it underscores how real-time data (ERP/WMS to dashboards) transforms decision-making speed. Once data streams into Power BI, further AI features (like predictive inventory forecasting or anomaly alerts) can be layered on top to enhance the solution even more.
5. Manufacturing – Global OEM (OEE and Plant Monitoring): A global manufacturing company with 8 plants deployed a new Fabric-based lakehouse analytics platform and Power BI to achieve real-time OEE (Overall Equipment Effectiveness) tracking. Previously, each plant’s MES and ERP systems required overnight batch reporting; plant managers often learned of quality issues hours late. A consulting partner implemented Azure Event Hubs to ingest IoT sensor data, piped it through Databricks/Delta Lake (Fabric), and built three tiers of Power BI dashboards (enterprise, plant, shop-floor) with as-low-as-15-second refresh intervals [40]. Key outcomes (with 12 weeks of work): OEE reporting lag went from “end of shift” to truly live, cutting decision latency by 35% [8]. Quality anomaly detection improved from “hours” lag to “minutes,” enabling engineers to find $2.1M of scrap in Q1 alone [8]. Furthermore, scrap rates dropped 33% as real-time alerts enabled immediate corrective action. Importantly, they achieved 92% user adoption on Day 1, demonstrating that live dashboards drive engagement [41]. Architecturally, the solution used Fabric’s Direct Lake mode (avoiding scheduled refresh by connecting live to the data lake) and role-based row security, but the core insight is clear: live Power BI visuals empowered plant managers to respond in real time to efficiency and quality issues, translating directly into cost savings.
6. Healthcare – ThoughtWire (Patient Monitoring): ThoughtWire, a healthcare technology company, built a real-time analytics solution on Azure and Power BI to monitor emergency department patients. Its “EarlyWarning” system continuously collects biometric data (heart rate, blood pressure, etc.) and runs streaming analytics. Key thresholds and deterioration markers feed into Power BI dashboards and alerting panels. The result is that clinicians are notified of patient risk as soon as their vitals cross danger signals [9]. The outcome: ThoughtWire reports significantly fewer unwarned code-blue events (full cardiac arrests) because “patient deterioration [is] detected early.” Improved patient outcomes and staff responsiveness directly attribute to the real-time analytics. This case underscores how AI+Power BI can be life-critical: real-time BI literally saves lives by giving medical staff immediate situational awareness. In effect, the platform continuously runs predictive models (some AI) on streaming health data, and Power BI visualizes the risk scores live.
7. Retail – PepsiCo (Demand Forecasting): Global retailer PepsiCo redesigned part of its supply-chain planning with Azure ML and Power BI. They centralized sales data and developed a suite of machine-learning models (14 markets, 28 models) to predict consumer demand at the store level. Outputs were pushed daily into Power BI for execution. Field associates and executives received Power BI dashboards showing prioritized actionable recommendations (e.g. how to adjust inventory allocations) [6]. The pilot saw 85% of suggested actions adopted by store managers, and forecasting accuracy improved by over 40%. Crucially, the integration with Power BI allowed these AI-driven insights to be delivered in context to users’ existing BI interface. The company estimates freeing 4,300 workdays per year previously spent on routine analysis [6]. Here, Power BI acted as the delivery layer for AI predictions, enabling near-real-time decision cycles in supply-chain (each week’s data fed new forecasts).
8. Consumer Goods – Reckitt (Marketing Insights): Reckitt, a consumer products giant, adopted Microsoft Fabric and Power BI to make marketing data truly actionable. They consolidated rich market and consumer data in Azure and then employed Azure OpenAI and Copilot for Power BI to generate insights. Marketers could pose queries to Copilot (e.g. “What consumer segments responded best to our latest campaign?”) and get narrative analyses and slides immediately. According to Reckitt, this “insights generator” empowered marketers to be more consumer-centric. The chief analytics officer reported a 60% boost in marketing efficiency: faster ideation, more relevant campaigns, and ideas that performed on par or better than traditional non-AI insights [5]. This example highlights Power BI’s new generative capabilities: AI writing compelling summaries and strategies based on the data, for business use. The real-time BI angle is in delivering up-to-date analytics and letting Copilot continuously interpret it as data arrives. While sustained dashboards were less emphasized, the ability to chat with the data in real time effectively transformed their decision process.
These case studies (summarized in Table 2) demonstrate multiple dimensions of “AI + Power BI = Real-Time BI”:
- Speed of Insight: Across cases, manual reporting cycles of hours/days were replaced by instantaneous dashboards [7] [8].
- Decision Quality: Integration of ML forecasts and anomaly detection led to measurable gains (40% better predictions, 60% efficiency increase, waste reductions, etc.) [6] [5].
- Broad Adoption: Users consistently embraced the live tools (e.g. 100% dashboard adoption, massive ROI estimates) [7] [8].
- Actionable Alerts: Real-time alerts (stockouts, traffic incidents, patient risk) enabled proactive responses, turning BI from passive reporting into active operations support.
Table 2: Case Study Outcomes for Real-Time AI-Powered BI
| Industry / Company | Use of AI + Power BI | Key Outcomes (Metrics) |
|---|---|---|
| Energy (TransAlta) | Azure Stream Analytics + Power BI Streaming | Live plant monitoring; “latest value” visibility for technicians [2] (no explicit % metric given). |
| Banking (Piraeus Bank) | ASA + Power BI Streaming | Real-time web KPI dashboards; adaptive scalability; “actionable events” for platform provisioning [3]. |
| Smart City (IntelliScape) | Video analytics + PubNub + Power BI | Live traffic/parking analytics; up-to-the-second alerts for city managers [36]. |
| Logistics (Regional Co.) | ERP/WMS → Power BI Dashboards | 80% reduction in manual reporting time; issues flagged in hours not days; 100% dashboard adoption [39]. |
| Manufacturing (Global OEM) | IoT sensors → Event Hubs → Fabric/Databricks → Power BI | OEE reports 35% faster (now real-time); $2.1M waste found (33% scrap drop); 92% user adoption [8]. |
| Healthcare (ThoughtWire) | Azure + Power BI (realtime streaming analytics) | Early patient deterioration detection; significant drop in unplanned code-blue events [9]. |
| Retail (PepsiCo) | Azure ML Models + Power BI Dashboards | 85% adoption of AI recommendations; forecasts 40% more accurate; ~4,300 workdays/year saved [6]. |
| Consumer Goods (Reckitt) | Azure OpenAI + Power BI Copilot | 60% boost in marketing efficiency; consumer-centric insights; new campaign ideas performed as well or better than non-AI insights [5]. |
Each of these examples was enabled by infusing AI into Power BI. They illustrate how real-time BI becomes valuable when paired with intelligent analysis: streaming data feed the dashboards, and AI algorithms immediately sift and interpret that data. The evidence is clear from industry and vendor reports that such systems deliver substantial performance improvements and ROI.
Implications, Challenges, and Future Directions
Organizational Impact and Considerations
The shift to AI-enhanced real-time BI has broad implications for enterprises. The immediate benefit is faster, more informed decision-making across the organization. As one analyst observed, “Dashboards show what happened, copilots guess why” [42] – a succinct way to say that BI is no longer just reactive. For operations teams, live BI with AI means catching issues early (e.g., a factory line can be shut down minutes after a sensor indicates a fault, rather than after days of data review). For executives, it means strategizing with live market intelligence. Companies report not just process improvements, but changes in culture: widespread data-driven decision-making is more feasible when data and insights appear in real time.
The democratization of analytics is another key implication. Traditional BI often required specialized analysts; AI features lower the expertise bar. A business manager can use natural language to query data (no SQL needed), or rely on auto-generated visuals instead of manual charting. This broadens the user base. According to Microsoft and user surveys, organizations see increased BI adoption when users can converse with data [39] [41]. Moreover, real-time AI-driven BI fosters collaboration: everyone sees the same live numbers and AI-backed insights, aligning strategies.
However, these advances also demand organizational adjustments:
-
Data Quality and Governance: With decisions happening faster, data accuracy becomes even more critical. Integrating AI means creating an explainable and auditable process. Farmer et al. argue that when an AI tool produces an insight, one must document “the AI model that produced it, the data used to train the model, and the level of confidence in the output.” [43]. Enterprises must ensure streaming pipelines are reliable (no stale or duplicated data) and that AI models are periodically validated. As one researcher notes, an LLM-based BI tool may “hallucinate” plausible but wrong correlations [32], so human oversight and data governance are essential.
-
Skill and Culture: Real-time AI BI requires new skills. According to Gartner, by 2026 a sizable share of organizations will require AI proficiency (even in recruiting) [44]. Analysts and even business staff need AI literacy: understanding when they can trust an automated insight and when deeper analysis is needed [45]. Training programs in data science and statistics, as well as familiarity with the new AI features, become important. There are also cultural hurdles: shifting from monthly reports to live dashboards means new workflows and possibly reorganizing teams for continuous monitoring.
-
Infrastructure and Cost: Real-time streaming and AI workloads can be compute-intensive. Enterprises must invest in cloud infrastructure (e.g. Azure Event Hubs, Stream Analytics, GPU-backed ML). While costs can be offset by efficiency gains, budgeting and architecture planning are key. Microsoft’s Fabric initiative (OneLake, lakehouses, and Real-Time Intelligence) partly addresses this by offering unified cloud services. Organizations should architect for scalability: as data volumes grow, streaming BI systems need to scale elastically. Security and compliance also must extend to real-time elements (for instance, ensuring streaming data is encrypted at rest and in motion).
-
Decision Processes: Operationally, teams must redefine processes around live analytics. Who watches the dashboards? What alerts do we set, and how do we react? For example, companies may create new roles (data product owners, AI-IQ champions) to oversee AI-generated recommendations. The human role shifts from pulling reports to monitoring and prompting AI agents [46]. According to analyst Gnana Prakash, businesses may need multi-disciplinary AI “analyst agents” in place, because generic copilots alone won’t suffice for deep enterprise context [42]. In practice, this means augmenting teams with data engineers, AI specialists, and frontline staff trained to interpret AI outputs responsibly.
Despite these challenges, the evidence suggests that early adopters gain a substantial competitive edge. Efficiency metrics (time savings, accuracy improvements, error reductions) are often reported in the tens of percent [39] [8]. Many organizations find the investment in streaming analytics pays off quickly through labor cost savings and better risk management. Indeed, recent surveys indicate high satisfaction: in one study, nearly 80% of BI users reported achieving “expected or better” results from their BI initiative, a dramatic increase over previous years (Source: kn.itmedia.co.jp).
Future Trends
Looking ahead, the convergence of AI and BI is accelerating. Several key trends will shape the next phase:
-
Generative AI & Copilots: The Copilot features in Power BI are only the beginning. As LLMs improve, we can expect richer natural-language interaction and automated storytelling. Future copilot agents may write entire reports or respond to spoken queries. Gartner predicts that by late 2020s, AI agents will be in over half of business intelligence applications [46] [47], effectively blending BI and collaborative intelligence. Some analysts warn, however, that early copilot tools can oversimplify; they advocate multi-agent “AI analysts” that combine specialized models (as suggested in the CIO article [48]).
-
Automated Root-Cause Analysis: Today’s anomaly detection flags irregularities, but future AI could autonomously diagnose them. Imagine a system that not only detects a drop in sales, but then seamlessly correlates it with, say, supply disruptions or social media sentiment and even proposes corrective actions. Technically, this requires more advanced ML and causal inference (areas of active research). Early hints of this are seen in Fabric’s Real-Time Intelligence demos, where Copilot suggests Kusto queries with a prompt (e.g. “average temperature by department” [49]) to explore patterns in streaming logs. As architectures like Fabric and OneLake mature, fully automated investigative assistants in BI may become common.
-
Edge and IoT Integration: The Internet of Things (IoT) explosion means data is generated at the edge (factories, vehicles, devices). AI+BI will move partially to the edge as well. For latency-critical scenarios, future BI systems may include edge analytics modules that run model inference locally and push summarized alerts to the cloud. Microsoft’s Azure IoT Central and Azure Sphere, combined with on-device ML, are evolving so that only essential insights (not raw streams) travel to Power BI. This could further reduce decision lag in scenarios like autonomous vehicles or real-time machinery control.
-
Stronger Augmented Analytics: Tools will continue to experiment with on-the-fly model training and adaptive learning. For example, Power BI’s analytic pane already includes one-click forecasting, but future versions may auto-select the best forecasting model per series. Data quality “auto-heal” features (e.g. using ML to auto-correct mislabeled data) will reduce the need for ETL. The boundary between BI platforms and data science platforms may blur; Gartner’s Hype Cycle suggests augmented analytics (auto-modeling) is already mainstream and improving .
-
Semantic Layer and Trust Frameworks: As noted previously, robust semantic models will be critical. When an LLM generates queries, it needs a trustworthy layer to ground results. Fabrics and Power BI datasets essentially provide a semantic layer (via tabular models). Organizations will invest in metadata catalogs and “explainability” to ensure AI insights have a traceable foundation [50]. We anticipate tools that automatically generate documentation of how an AI insight was derived, boosting trust. Governance frameworks (and likely regulation) will also require audit trails for data used in AI BI.
In summary, the fusion of AI with Power BI is just beginning. Next-generation BI will be more autonomous (AI agents continually analyzing), more interactive (conversational and even voice-driven), and more predictive (anticipating risks before they materialize). Microsoft’s ongoing development (Azure AI services, Fabric platform, Copilot expansion) and the broader data ecosystem (LLM research, edge computing) suggest this transition will accelerate in the next few years.
Conclusion
AI with Power BI is fundamentally transforming business intelligence from passive dashboards to active, real-time intelligence platforms. By embracing AI features—automated analytics, natural-language interfaces, predictive models—and coupling them with live data streaming, organizations can accelerate insight generation and decision-making. The evidence for these benefits is robust: companies spanning energy, finance, manufacturing, retail, and healthcare consistently report major gains in efficiency, accuracy, and responsiveness [7] [8] [6] [5]. These gains come from redistributing human effort (for example, reducing manual report generation by 80% in one case [7]) and catching problems early.
Yet the journey requires careful planning. The power of AI demands commensurate attention to data governance, model validation, and user training. As TDWI analysts warn, LLM-generated insights should be treated cautiously to avoid “hallucinated” conclusions [32]. Organizations must also align processes and roles to a 24/7 intelligence model, ensuring that live insights translate into timely actions. The very nature of decision-making changes: rather than huddling over monthly reports, leaders engage with continuously updated data streams. This cultural shift is as important as the technology itself.
Looking forward, the frontier of AI-driven BI is bright. Microsoft’s strategic pivot to integrated analytics (Fabric) and AI (Copilot, Azure AI) shows that real-time, AI-enhanced BI is central to the modern data stack. Gartner and other experts forecast that by the end of this decade, enterprise analytics will be dominated by AI-infused, conversational, and even autonomous systems [51] [33]. Power BI – increasingly powered by Azure’s cognitive and generative services – stands at this forefront.
In conclusion, AI-powered Power BI unlocks real-time BI by closing the loop between data and action. It empowers every employee—technical or non-technical—to query live data, detect trends instantly, and trust automated insights. As demonstrated by real-world results, this synergy offers a potent competitive advantage. Organizations that thoughtfully integrate these capabilities will not only see their existing BI metrics improve (speed of reporting, forecast accuracy) but will elevate their entire decision-making agility. All claims in this report are grounded in documented industry findings and case evidence [19] [7] [6] [5]. The conclusion is unmistakable: when AI enriches Power BI, businesses achieve intelligence that is not just informative but real-time, actionable, and game-changing.
External Sources (51)
About
Tapflare
Tapflare in a nutshell Tapflare is a subscription-based “scale-as-a-service” platform that hands companies an on-demand creative and web team for a flat monthly fee that starts at $649. Instead of juggling freelancers or hiring in-house staff, subscribers are paired with a dedicated Tapflare project manager (PM) who orchestrates a bench of senior-level graphic designers and front-end developers on the client’s behalf. The result is agency-grade output with same-day turnaround on most tasks, delivered through a single, streamlined portal.
How the service works
- Submit a request. Clients describe the task—anything from a logo refresh to a full site rebuild—directly inside Tapflare’s web portal. Built-in AI assists with creative briefs to speed up kickoff.
- PM triage. The dedicated PM assigns a specialist (e.g., a motion-graphics designer or React developer) who’s already vetted for senior-level expertise.
- Production. Designer or developer logs up to two or four hours of focused work per business day, depending on the plan level, often shipping same-day drafts.
- Internal QA. The PM reviews the deliverable for quality and brand consistency before the client ever sees it.
- Delivery & iteration. Finished assets (including source files and dev hand-off packages) arrive via the portal. Unlimited revisions are included—projects queue one at a time, so edits never eat into another ticket’s time.
What Tapflare can create
- Graphic design: brand identities, presentation decks, social media and ad creatives, infographics, packaging, custom illustration, motion graphics, and more.
- Web & app front-end: converting Figma mock-ups to no-code builders, HTML/CSS, or fully custom code; landing pages and marketing sites; plugin and low-code integrations.
- AI-accelerated assets (Premium tier): self-serve brand-trained image generation, copywriting via advanced LLMs, and developer tools like Cursor Pro for faster commits.
The Tapflare portal Beyond ticket submission, the portal lets teams:
- Manage multiple brands under one login, ideal for agencies or holding companies.
- Chat in-thread with the PM or approve work from email notifications.
- Add unlimited collaborators at no extra cost.
A live status dashboard and 24/7 client support keep stakeholders in the loop, while a 15-day money-back guarantee removes onboarding risk.
Pricing & plan ladder
| Plan | Monthly rate | Daily hands-on time | Inclusions |
|---|---|---|---|
| Lite | $649 | 2 hrs design | Full graphic-design catalog |
| Pro | $899 | 2 hrs design + dev | Adds web development capacity |
| Premium | $1,499 | 4 hrs design + dev | Doubles output and unlocks Tapflare AI suite |
All tiers include:
- Senior-level specialists under one roof
- Dedicated PM & unlimited revisions
- Same-day or next-day average turnaround (0–2 days on Premium)
- Unlimited brand workspaces and users
- 24/7 support and cancel-any-time policy with a 15-day full-refund window.
What sets Tapflare apart
Fully managed, not self-serve. Many flat-rate design subscriptions expect the customer to coordinate with designers directly. Tapflare inserts a seasoned PM layer so clients spend minutes, not hours, shepherding projects.
Specialists over generalists. Fewer than 0.1 % of applicants make Tapflare’s roster; most pros boast a decade of niche experience in UI/UX, animation, branding, or front-end frameworks.
Transparent output. Instead of vague “one request at a time,” hours are concrete: 2 or 4 per business day, making capacity predictable and scalable by simply adding subscriptions.
Ethical outsourcing. Designers, developers, and PMs are full-time employees paid fair wages, yielding <1 % staff turnover and consistent quality over time.
AI-enhanced efficiency. Tapflare Premium layers proprietary AI on top of human talent—brand-specific image & copy generation plus dev acceleration tools—without replacing the senior designers behind each deliverable.
Ideal use cases
- SaaS & tech startups launching or iterating on product sites and dashboards.
- Agencies needing white-label overflow capacity without new headcount.
- E-commerce brands looking for fresh ad creative and conversion-focused landing pages.
- Marketing teams that want motion graphics, presentations, and social content at scale. Tapflare already supports 150 + growth-minded companies including Proqio, Cirra AI, VBO Tickets, and Houseblend, each citing significant speed-to-launch and cost-savings wins.
The bottom line Tapflare marries the reliability of an in-house creative department with the elasticity of SaaS pricing. For a predictable monthly fee, subscribers tap into senior specialists, project-managed workflows, and generative-AI accelerants that together produce agency-quality design and front-end code in hours—not weeks—without hidden costs or long-term contracts. Whether you need a single brand reboot or ongoing multi-channel creative, Tapflare’s flat-rate model keeps budgets flat while letting creative ambitions flare.
Disclaimer
This document is provided for informational purposes only. No representations or warranties are made regarding the accuracy, completeness, or reliability of its contents. Any use of this information is at your own risk. Tapflare shall not be liable for any damages arising from the use of this document. This content was generated with assistance from artificial intelligence tools, which may contain errors or inaccuracies. Readers should verify critical information independently. All product names, trademarks, and registered trademarks mentioned are property of their respective owners and are used for identification purposes only. Use of these names does not imply endorsement. This document does not constitute professional or legal advice. For specific guidance related to your needs, please consult qualified professionals.